Thursday, June 16, 2022

Grafana - average size of log line

As I'm currently participating on Grafana observability stack Plan & Design exercise, I would like to know what is the average size of log line ingested into the observability stack. Such information is pretty useful for capacity planning and sizing.

Log lines are stored on Loki log database and Loki itself is exposing metrics into Mimir time series database for self monitoring purpose. Grafana Loki and Promtail metrics are documented here.

The following formula calculates average size of log message:

sum(rate(loki_distributor_bytes_received_total [7d])) / sum(rate(loki_distributor_lines_received_total [7d]))

The result is visualized in the screenshot below.

 Hope this tip will be useful for someone else.

Tuesday, April 26, 2022

Farewell VMware

The clever people and Buddhists know that the only constant thing in the world is change. The change is usually associated with transition, and as we all know, transitions are not easy, but generally good and inevitable things. All transitions are filled with anticipation and potential risks, however, any progress and innovations are only achieved by accepting the risk and going outside of the comfort zone. That's one of the reasons I have decided to leave VMware, even though VMware organization and technologies are very close to my heart, and I truly believe that the VMware software stack is one of the most important IT technology stacks for the future of humans. 

As I prepare to move on, I have to say goodbye and a big thank you to the VMware organization. VMware technologies are part of my daily life for a long time, using the technology since 2006, and I’ll really miss the VMware family I joined back in 2015. It was a great time, and I will especially miss VMware core technical folks transforming the industry and building one of the best software-defined infrastructure stacks humans have done so far. 

And where do I actually go? Back in 2001, I was the co-founder of the software start-up, where I started my professional career by architecting, developing, and operating the air ticket online booking platform, which was later acquired by Galileo Travelport https://www.travelport.com. Now, after 20 years, I have got the proposal to help Kiwi.com to become the # 1 digital system in the modern digitalized travel industry. For those who do not know Kiwi.com, Kiwi.com was originally a Czech start-up growing into a worldwide #3 air ticketing booking platform. They were acquired by General Atlantic back in 2019 https://www.generalatlantic.com/media-article/general-atlantic-announces-strategic-partnership-with-travel-platform-kiwi-com/, and General Atlantic’s past and current investments in the global online travel industry include Priceline, Airbnb, Meituan, Flixbus, Uber, Despegar, Smiles and Mafengwo can tell you where the online travel industry is heading. Those who can read between the lines understand that such a mix allows to build optimal door-to-door traveling for the next human generation(s). I have decided that I would like to be part of such travel industry transformation! Not only because Kiwi.com really does multi-cloud with Kubernetes at a large scale, but mainly to be part of a very young, innovative, and inspiring team including hundreds of software developers and dozens of infrastructure platform and DevOps engineers operating everything as cloud computing.

I'm expecting big fun and you can expect more blog posts about DevOps, multi-cloud, Docker, Kubernetes, CI/CD, Observability, and infrastructure for modern applications because I have to learn and test a lot of new technologies and writing the blog post is the great way to share new knowledge and getting the feedback from other folks in various communities.

Hope my blog will be still useful for my current readers who are typically very IT infrastructure-oriented, however, the software eats the world, and the IT infrastructure is here to support software, isn't it? 

Sunday, April 03, 2022

VMware vSphere DRS/DPM and iDRAC IPMI

I have four Dell server R620 in my home lab. I'm running some workloads which have to run 24/7 (DNS/DHCP server, Velocloud SD-WAN gateway, vCenter Server, etc.), however,  there are other workloads just for testing and Proof of Concepts purposes. These workloads are usually powered off. As electricity costs will most probably increase in near future, I realized VMware vSphere DRS/DPS (Distributed Resource Scheduler/Distributed Power Management) could be a great technology to keep the bill of electricity at an acceptable level.

VMware vSphere DPM is using IPMI protocol to manage physical servers. IPMI has to be configured per ESXi server as depicted in the screenshot below.

I have iDRAC Enterprise in my Dell servers and I thought it will be a simple task to configure iDRAC by just entering the iDRAC username, password, IP address, and MAC address.

However, I have realized that the configuration operation fails with an error message "A specified parameter was not correct: ipmiInfo".


During troubleshooting, I tested ipmi (ipmitool -I lanplus -H 192.168.4.222 -U root -P calvin chassis status) from FreeBSD operating system, and I have realized it does not work as well.

That led me to do some further research and to find, that iDRAC doesn't have IPMI enabled by default. iDRAC command to get the IPMI status is "racadm get iDRAC.IPMILan"

iDRAC command "racadm set iDRAC.IPMILan.Enable 1" enables IPMI over LAN and the command "racadm get iDRAC.IPMILan" can be used to validate the IPMI over LAN status.

After such iDRAC configuration, I was able to use IPMI from FreeBSD operating system.

And it worked correctly in VMware vSphere as well as depicted in the screenshot below. 


When IPMI is configured correctly on ESXi, the ESXi host can be switched into Standby Mode manually from vSphere Client as ESXi action.   


The ESXi Standby Mode is used for vSphere DRS/DPM automation. 


Job done!

Hope this helps some other folks in the VMware community.

Thursday, March 17, 2022

vSAN Health Service - Network Health - vSAN: MTU check

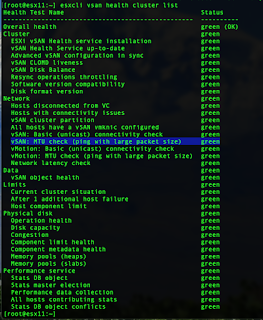
I have a customer having an issue with vSAN Health Service - Network Health - vSAN: MTU check which was, from time to time, alerting the problem. Normally, the check is green as depicted in the screenshot below.

The same can be checked from CLI via esxcli.

However, my customer was experienced intermittent yellow and red alerts and the only way was to retest the skyline test suite. After retesting, sometimes it switched back to green, sometimes not.

During the problem isolation was identified that the only problem is on vSAN clusters having witness nodes (2-node clusters, stretched clusters). Another indication was that the problem was identified only between vSAN data nodes and vSAN witness. The network communication between data nodes was always ok.

How is this particular vSAN health check work?

It is important to understand, that “vSAN: MTU check (ping with large packet size)”

  • is not using “don’t fragment bit” to test end-to-end MTU configuration
  • is not using manually reconfigured (decreased) MTU from vSAN witness vmkernel interfaces leveraged in my customer's environment. The check is using static large packet size to understand how the network can handle it.
  • The check is sending the large packet between ESXi (vSAN Nodes) and evaluates packet loss based on the following thresholds:
    • 0% <-> 32% packet loss => green
    • 33%  <-> 66% packet loss => yellow
    • 67%  <-> 100% packet loss => red
The vSAN health check is great to understand if there is a network problem (packet loss) between vSAN data nodes. The potential problem can be on ESXi hosts or somewhere in the network path.

So what's the problem?

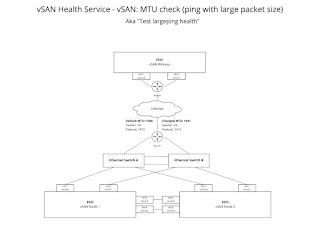
Let's visualize the environment architecture which is depicted in the drawing below.


The customer has vSAN witness in a remote location and experiencing the problem only between vSAN data nodes and vSAN witness node. Large packet size ping (ping -s 8000) to vSAN witness was tested from ESXi console to test if packet loss is observed there as well.  As we have observed the packet loss, it was the indication, that the problem is somewhere in the middle of the network. Some network routers could be overloaded and do not provide fast enough packet fragmentation causing packet loss.

Feature Request

My customer understands that this is the correct behavior, and everything works as is designed. However, as they have a large number of vSAN clusters, they would highly appreciate, if the check "vSAN: MTU check (ping with large packet size)" would be separated into two independent tests.
  • Test #1: “vSAN: MTU check (ping with large packet size) between data nodes”
  • Test #2: “vSAN: MTU check (ping with large packet size) between data nodes and witness”
We believe that such functionality would significantly improve the operational experience for large and complex environments.

Hope this explanation helps someone else within the VMware community.

Thursday, March 03, 2022

How to get vSAN Health Check state in machine-friendly format

I have a customer with dozens of vSAN clusters managed and monitored by vRealize Operations (aka vROps). vROps has a management pack for vSAN but there are not all features my customer is expecting for day-to-day operations. vSAN has a great feature called vSAN Skyline Health which is essentially a test framework periodically checking the health of vSAN state. Unfortunately, vSAN Skyline Health is not integrated with vROps which might or might not change in the future. Nevertheless, my customer has to operate vSAN infrastructure today, therefore, we are investigating some possibilities for how to develop some custom integration between vSAN Skyline Health and vROps.

The first thing we have to solve is how to get vSAN Skyline Health status in some machine-friendly format. It is well known that vSAN is manageable via esxcli.

Using ESXCLI output

Many ESXCLI commands generate the output you might want to use in your application. You can run esxcli with the --formatter dispatcher option and send the resulting output as input to a custom parser script.

Below are ESXCLI commands to get vSAN HealthCheck status.

esxcli vsan health cluster list
esxcli --formatter=keyvalue vsan health cluster list
esxcli --formatter=xml vsan health cluster list

Option formatter can help us to get the output in machine-friendly formats for automated processing.

If we want to get a detailed Health Check description we can use the following command

esxcli vsan health cluster get -t "vSAN: MTU check (ping with large packet size)"

Option -t contains the name of a particular vSAN HealthCheck test.

Example of one vSAN Health Check:

[root@esx11:~] esxcli vsan health cluster get -t "vSAN: MTU check (ping with large packet size)"

vSAN: MTU check (ping with large packet size) green
Performs a ping test with large packet size from each host to all other hosts.
Ask VMware: http://www.vmware.com/esx/support/askvmware/index.php?eventtype=com.vmware.vsan.health.test.largepin...
Only failed pings
From Host To Host To Device Ping result
--------------------------------------------------------
Ping results
From Host To Host To Device Ping result
----------------------------------------------------------------------
192.168.162.111 192.168.162.114 vmk0 green
192.168.162.111 192.168.162.113 vmk0 green
192.168.162.111 192.168.162.112 vmk0 green
192.168.162.112 192.168.162.111 vmk0 green
192.168.162.112 192.168.162.113 vmk0 green
192.168.162.112 192.168.162.114 vmk0 green
192.168.162.113 192.168.162.114 vmk0 green
192.168.162.113 192.168.162.112 vmk0 green
192.168.162.113 192.168.162.111 vmk0 green
192.168.162.114 192.168.162.111 vmk0 green
192.168.162.114 192.168.162.112 vmk0 green
192.168.162.114 192.168.162.113 vmk0 green

Conclusion

This very quick exercise shows the way how to programmatically get vSAN Skyline Health status via ESXCLI and somehow parse it and leverage vROps REST API to insert these data into vSAN Cluster objects as metrics. There is PowerShell/PowerCLI way how to leverage ESXCLI and do some custom automation, however, it is out of the scope of this blog post.  

Tuesday, March 01, 2022

Linux virtual machine - disk.EnableUUID

I personally prefer FreeBSD operating system to Linux, however, there are applications which is better to run on top of Linux. When playing with Linux, I usually choose Ubuntu. After fresh Ubuntu installation, I realized a lot of entries within log (/var/log/syslog) which is annoying. 

Mar  1 00:00:05 newrelic multipathd[689]: sda: add missing path
Mar  1 00:00:05 newrelic multipathd[689]: sda: failed to get udev uid: Invalid argument
Mar  1 00:00:05 newrelic multipathd[689]: sda: failed to get sysfs uid: Invalid argument
Mar  1 00:00:05 newrelic multipathd[689]: sda: failed to get sgio uid: No such file or directory
Mar  1 00:00:10 newrelic multipathd[689]: sda: add missing path
Mar  1 00:00:10 newrelic multipathd[689]: sda: failed to get udev uid: Invalid argument
Mar  1 00:00:10 newrelic multipathd[689]: sda: failed to get sysfs uid: Invalid argument
Mar  1 00:00:10 newrelic multipathd[689]: sda: failed to get sgio uid: No such file or directory

It is worth mentioning that Ubuntu Linux is the Guest OS within a virtual machine running on top of VMware vSphere Hypervisor (ESXi host).

After a quick googling I have found several articles with the solution ...
The solution is very simple ...

The problem is that VMWare by default doesn't provide the information needed by udev to generate /dev/disk/by-id entries. The resolution is to put 
 disk.EnableUUID = "TRUE"  
into VM advanced settings.

If you use vSphere Client connected to vCenter, you have to 
  1. Power Off particular Virtual Machine
  2. Go to Virtual Machine -> Edit Settings
  3. Select tab VM Options
  4. Expand Advanced section
  5. Click EDIT CONFIGURATION
  6. Add New Configuration Parameter (disk.EnableUUID with the value TRUE)
  7. Save the advanced settings
  8. Power On Virtual machine
Below are screenshots from my home lab ...


Hope this helps someone else within the VMware community. 

Sunday, January 23, 2022

What FreeBSD type of NIC to use in VMware Virtual Machine?

Today, I have received a question from one of my readers based in Germany. Hellmuth has the following question ...

Hi,

i just stumbled across your blog and read that you use FreeBSD.

For a long time, I wondered what to choose as the „best“ guest driver for FreeBSD: em, the vmx in the FreeBSD source, or the kld which comes with the open VMware Tools ?

Do you have an idea ? What do you use ?

Best regards,

Hellmuth

So here is the answer to Hellmuth and I believe, the answer can help somebody else in VMware and FreeBSD communities.

Thursday, January 20, 2022

Energetics and Distributed Cloud Computing

The Energy

The cost of energy is increasing. A significant part of electrical energy cost is the cost of distribution. That's the reason why the popularity of small home solar systems increases. That's the way how to generate and consume electricity locally and be independent of the distribution network. However, we have a problem. "Green Energy" from solar, wind, and hydroelectric power stations is difficult to distribute via the electrical grid. Energy accumulation (batteries, pumped storage power plant, etc.) is costly and for the traditional electrical grid is very difficult to automatically manage the distribution of so many energy sources. 

The Cloud Computing

The demand for cloud (computing and storage) capacity is increasing year by year. Internet bandwidth increases and cost decreases every year. 5G Networks and SD-WANs are on the radar. Cloud Computing is operated on data centers. A significant part of data center costs is the cost of energy. 

The potential synergy between Energetics and Cloud Computing 

The solution is to consume electricity in the proximity of green power generators. Excess electricity is accumulated into batteries but batteries capacity is limited. We should treat batteries like a cache or buffer to overcome times when green energy does not generate energy but we have local demand. However, when we have excess electricity and the battery (cache/buffer) is full, instead of providing the energy into the electrical grid, the excess electricity can be consumed by a computer system providing compute resources to cloud computing consumers over the internet. This is the form of Distributed Cloud Computing. 

Cloud-Native Applications

So, let's assume we will have Distributed Cloud Computing with so-called Spot Compute Resource Pools". Spot Compute Resource Pools are computing resources that can appear or disappear within hours or minutes. This is not optimal IT infrastructure for traditional software applications which are not infrastructure aware. For such distributed cloud computing the software applications must be designed and developed with infrastructure resources ephemerality in mind. In other words, Cloud-Native Applications must be able to leverage ephemeral compute resource pools and know how to use "Spot Compute Resource Pools".

Conclusion

With today's technology, it is not very difficult to roll out such a network of data centers providing distributed cloud computing and consuming locally the excess electricity from "green" electric sources. I'm planning the Proof of Concept in my house in the middle of this year and let you know about some real experiences because the devil is in detail.

The conceptual Design of such a solution is available at https://www.slideshare.net/davidpasek/flex-cloud-conceptual-design-ver-02

If you would like to discuss this topic, do not hesitate to use the comments below the blog post or open discussion on Twitter @vcdx200.

Wednesday, January 19, 2022

How to avoid or at least mitigate the risk of software and hardware component failures?

Last Thursday, my Firefox web browser stopped working at a regular zoom meeting with my team. Today, thanks to The Register, I realized that it was due to a Foxstuck software bug. For further details about the bug read https://www.theregister.com/2022/01/18/foxstuck_firefox_browser_bug_boots/ 

My troubleshooting was pretty quick. Both Chrome and Safari worked fine, so it was evident that this was definitely the Firefox issue.

I tried various classic tricks to solve the Firefox problem (clearing the cache, cookies, reinstalling the software to the latest version, etc.), but because nothing helped in the 10 minutes I was willing to invest, I decided I didn't have time for further experiments and after about a year of using Firefox, I switched back to Chrome.

The switch over was all about transferring important data from Firefox to Chrome. I use an external password manager (thank god), so the only important data in Firefox were my bookmarks. Exporting bookmarks from Firefox and importing them into Chrome was a matter of seconds.

Problem solved. Hurrah!

But, it's clear that a similar software bug may hit Chrome or Safari in the future, so it's only a matter of time before I will be forced to switch to another web browser. Actually, Chrome has made me angry in the past and that was the reason to switch to Firefox.

So what is the moral of this story?

The only way not to be affected by such software bugs is dual, triple, or even multi-vendor strategy (in this case Firefox, Chrome, Safari) and the art of quickly identifying a problematic component and replacing it with another.

This blog is about data centers, data center infrastructure, and software-defined infrastructure. Does it apply here? I think so.

In the hardware area, we can solve the MULTI-VENDOR strategy using a computer, storage, and network virtualization, where VMware is the industry leader. Server virtualization (ESXi) gives us hardware abstraction so we use HPE, Dell, or Lenovo servers in the same way. Storage virtualization (vSAN, vVols) gives us storage abstraction and independence on storage vendors. Network virtualization does the same for network components like a switch, router, firewall, and load balancer. 

When we virtualize all hardware components we have a software-defined infrastructure. If we do not want to plan, design, implement and operate software-defined infrastructure by ourselves, we can outsource it to cloud providers and consume it as a service. This is IaaS cloud infrastructure.

If we consume IaaS cloud infrastructure, we can solve the MULTI-VENDOR strategy using MULTI-CLOUD. The MULTI-CLOUD strategy is based on the assumption that if one IaaS cloud provider fails, the other cloud providers will not fail at the same time, therefore such strategy has a positive impact on the availability and/or recoverability.

And if we already have an adopted MULTI-CLOUD strategy, then we only lack modernly designed applications that can automatically detect an infrastructure failure of one cloud provider and recover from it by a fast application fail-over to another cloud. Kubernetes can help with multi-cloud from an infrastructure point of view but in the end, it is all about the application architecture having self-healing natively within application DNA. The application architected for MULTI-CLOUD architecture is, at least for me, the CLOUD NATIVE APPLICATION. The application, which is able to live in the cloud and survive inevitable failures. This is exactly how the human body works and how the human civilizations are migrating between the regions. That's why we have multi-site and multi-region architectures and cloud-native applications are able to recognize where is the best place to live, do some cost analysis and migrate if it makes sense. Isn't it similar to humans? 

And that's it. Easy to write, isn't it? ... The real implementation of MULTI-CLOUD architecture is a bit trickier, but with today's technology, it's feasible.

Wednesday, October 20, 2021

Kubernetes vSphere CSI Driver

The main reason why I do blogging is to document some technical details and design patterns I discuss with my customers. Usually, I decide to write the blog post about some topic, when there are more then two customers wanting to know some technical details or experiencing some technical challenge.

Today I will write a first blog about Kubernetes. It seems to me that Kubernetes has finally reached the momentum and everybody is trying to jump into the wagon. It is obvious, that Kubernetes is the infrastructure platform for modern distributed applications. VMware has recognized this trend very early and integrated Kubernetes into VMware vSphere platform, also known as Tanzu. I do not want to describe Tanzu platform from product perspective because there are plenty of such blog posts across the blogosphere. Cormac Hogan is my favorite Tanzu/Kubernetes blogger, probably because in the past he was blogging about vSphere and storage related topics. Therefore, if you want to get some info about VMware Tanzu, I highly recommend Cormac's blog which is available at https://cormachogan.com/.

In this article, I would like to describe the architecture overview of vSphere CSI Driver and some process flow behind the scene.

Disclaimer: Please note that this is just my personal understanding how it works and some things can be inaccurate or at very high detail. Nevertheless, if you believe there is something totally wrong, speak up in comments below the article.

First thing first, I'm the visual guy therefore let's start with overall solution architecture.


 The DevOps process to create persistent volume is following

  • DevOps Admin will ask Kubernetes cluster to create persistent volume via kubectl and YAML manifest (aka persistent volume claim)
  • CSI driver has control plane in K8s supervisor and CSI Driver agents on all K8s worker nodes
  • DevOps Admin request (claim) of persistent volume is sent to CSI driver control plane
  • CSI driver control plane is integrated with vCenter server via vSphere API
  • CSI driver control plane via vCenter API asks vSphere to create storage volume.
  • Storage volume can be VMDK file on VMFS filesystem, vSAN object, vVol (lun on physical storage) or NFS shared storage (mountpoint).
  • vCenter will create such storage volume via some ESXi host
  • CSI driver control plane can leave such storage volume unattached (aka FCD - First Class Disk) or it can attach the storage volume into particular ESXi host because eventually it knows into which K8s pod (container) such volume should be attached. And it also knows in which K8S Worker Node (linux guest os on top of virtual machine) the K8s pod is running, therefore, it dynamically attach the volume (it leverages hot-plug/hot-add capability) to particular virtual machine.
    • Note 1: block persistent volumes are attached to virtual machines via PVSCSI driver as it supports higher number (64) of disks and as virtual machine supports up to four (4) SCSI adapters, single VM (K8s worker node) can have up to 256 volumes.
    • Note 2: CSI driver can add additional PVSCSI adapters to VM dynamically
    • Note 3: It only works when VM addvaced setting "devices.hotplug" is enabled, which is default setting.
  • Finally, CSI driver agent detects new storage volume within K8s worker node (linux guest os) and because it knows into which K8s pod (linux container / chroot) the particular volume should be attached, it will attach it to the desired container (pod).

Hope I did not forget something in the automated workflow vSphere CSI driver is doing :-)

I guess now you would ask me, how DevOps admin issues persistent volumes claims into K8s cluster, right?

Well, it is two step process. The first of all, K8s cluster must know K8s Storage Class which is later used for persistent volume claims. Storage Class is just a mapping between vSphere Storage Policy and K8s Storage Class object (aka kind). If you are not yet familiar with VMware vSphere SPBM (Storage Policy Based Management), please read this.

The second step is to create Persistent Volume Claim, describing the particular storage request.

Examples of both Kubernetes (YAML) requests are below. 


I believe examples above are self-explanatory. 

Hope this article helps broader VMware user community to understand what is under the cover.

References:


Monday, October 04, 2021

2-Node vSAN Direct Connect and LACP

One of my customers is using 2-node vSANs on multiple branch offices. One of many reasons of using 2-node vSAN is the possibility to leverage existing 1 Gb network and use 25 Gb Direct Connect between ESXi hosts (vSAN nodes) without the need of 25 Gb Ethernet switches. Generally they have very good experience with vSAN, but recently they have experienced vSAN Direct Connect outages when testing the network resiliency. The resiliency test was done by administrative shutdown of one vmnic (physical NIC port) on one vSAN node. After further troubleshooting, they realized their particular NICs (Network Adapters) do not propagate link down state to the physical link, when vmnic is administratively disabled by command "esxcli network nic down -n vmnic2". 

It is worth to mention, that such network outage does not mean 2-node vSAN outage because that's the reason why we have vSAN witness, however, vSAN is in degraded state and cannot provide mirror (RAID1) protection of vSAN objects.

Such network behavior is definitely strange and we have opened discussion and root cause analysis with hardware vendor, however, we have also started the internal discussion about design alternatives we have to mitigate such weird situations and increase resiliency and the overall availability of vSAN system.

Here are three design options how to implement direct connect networking between two ESXi hosts.

Design Option 1 - Switch independent teaming with explicit fail-over

Option 1 is using single VMkernel interface (vmk2) connected to single vSwitch portgroup which is using two uplinks with explicit fail-over teaming where vmnic2 is the explicit active uplink and vmnic3 will be used only in case vmnic2 is not available.
 

This design option is generally recommended by VMware.

Benefits: simple configuration, highly available solution

Drawbacks: in case of link state hardware problem, you can be in situation when one vSAN node is using VMkernel interface via vmnic2 uplink and 

Design Option 2 - Link Aggregation (LACP)

Option 2 is using single VMkernel interface (vmk2) connected to single vSwitch portgroup having single logical uplink (LAG) which is backed by two uplinks (vmnic2, vminc3) bonded into the port-channel. In such network configuration, both uplinks are active. It is worth to mention, that in 2-node configuration, LACP load balancing algorithm can help with load balancing of vSAN traffic across both uplinks, but the benefit of LACP is periodical heart beating (sending LACPDU) which is by default done every 30 seconds (slow LACP). For more information LACP timers read this blog post.

Benefits: LAG virtual interface with LACPDU heart beating can mitigate the risk of black hole scenario in case of problems with link state.

Drawbacks: 

  • LACP configuration is more complicated than switch independent teaming, therefore it has a negative impact on manageability. 
  • Network availability is not guaranteed with multiple vmknics in some asymmetric failures, such as one NIC failure on one host and another NIC failure on another host. However, more bundled links can increase vSAN traffic availability, because vSAN L3 connectivity would stay up and running until single L1 link is up.

Useful LACP commands

  • esxcli network vswitch dvs vmware lacp status get
  • esxcli network vswitch dvs vmware lacp stats get
  • esxcli network nic down -n vmnic2 
  • esxcli network nic up -n vmnic2

Design Option 3 - Two vSAN Air Gap Network

Two vSAN Air Gap Networks actually means two vSAN vmkernel interfaces connected to two totally independent (air gap) networks.

Benefits: Little bit easier configuration than LACP.

Drawbacks: 

  • Setup is complex and error prone, so troubleshooting is more complex. 
    • Requires multiple L3 VMkernel interfaces for vSAN traffic. 
  • Network availability is not guaranteed with multiple vmknics in some asymmetric failures, such as one NIC failure on one host and another NIC failure on another host. 
  • Source: Pros and Cons of Air Gap Network Configurations with vSAN

Conclusion and design decision

In this blog post, I have described three different option of network configuration for vSAN direct connect. I personally believe, the design option 2 (LACP for vSAN Direct Connect) is the optimal design decision, especially if NIC link state propagation is not reliable as is the case for my customer. However, the design option 2 is solving the issue as well. The final design decision is on the customer.

Friday, October 01, 2021

Enhanced Load Balancing Path Selection Policy

This blog post will be very short.

Few years ago I wrote the blog post about this topic. It is available here so read it for further details.

What we have today realized with my colleagues, this VMW_PSP_RR sub-policy options is enabled by default, therefore VMware Round Robin multi-pathing policy is considering I/O latency for optimal storage path selection.

The ESXi setting can be validated in ESXi shell by command

esxcfg-advcfg -g /Misc/EnablePSPLatencyPolicy 

where the output in ESXi 6.7 U3 and above is

Value of EnablePSPLatencyPolicy is 1

Note: 1 is TRUE.

This is the reason, why you can observe different traffic via different storage paths.

Thursday, September 30, 2021

VMware Distributed Switch - vSphere 6.7 versus 7.0

This will be a really quick heads-up for those upgrading vSphere 6 to vSphere 7.

I've been informed by one colleague, that his customer had an network outage when he upgraded VMware Distributed Switch (aka VDS) from version 6.6.0 (vSphere 6.7 U3) to 7.0.2 (vSphere 7.0 U2).

That was a surprise, as we were not aware about any VDS upgrade issues in the past.

The network outage was observed on Microsoft Network Load Balancers (aka NLB) which was a pretty good hint for Root Cause Analysis.

After the further analysis, the root cause was the change of VMware DVS default advanced setting "Multicast filtering mode".

In vSphere 6.7, the default "Multicast filtering mode" is basic.


In vSphere 7.0, the default "Multicast filtering mode" is IGMP/MLD Snooping.


For those who know how IGMP Snooping works, it is not a big surprise why it might be problem for Microsoft Network Load Balancer.

Hope this will help broader VMware community.


Thursday, September 09, 2021

vSphere design : ESXi protection against network port flapping

I've just finished a root cause analysis of VM restart in customer production environment, so let me share with you the symptoms of the problem, current customer's vSphere design and recommended improvement to avoid similar problems in the future. 

After the further discussion with customer we have identified following symptoms:

  • VM was restarted in different ESXi host
  • original ESXi host, where VM was running before the restart, was isolated (network isolation)
  • vSAN was partitioned

What does it mean?

Well, for those understanding how vSphere HA Cluster works it is pretty simple diagnosis.

  • ESXi was isolated from the network
  • HA Cluster "Response for Host Isolation Response" was set to "Power Off and restart VMs"
    • this is recommended setting for IP storage, because when network is not available, there is a huge probability, the storage is not available and VM is in trouble
    • customer has vSAN, which is a IP storage, therefore such setting makes perfect sense

That having said, this was the reason VM was restarted and it is expected behavior to achieve higher VM availability in cost of some small unavailability because of VM restart.   

However, there is a logical question.

Why was ESXi isolated from network when there is network teaming (vmnic1 + vmnic3) configured?

The customer environment is depicted on design drawing below.

When vSAN is used, vSphere HA heart beating is happening across vSAN network, therefore vmk3 L3 interface (vSAN) is in use, leveraging vmnic1 and vmnic3 uplinks. Customer has both uplinks active with "Route based on originating virtual port", therefore the traffic goes either through vminc1 or vmnic3. This is called uplink pinning and only one uplink is used for vSphere HA heart beat traffic.

Customer is using VMware LogInsight (syslog + data analytics) for central log management, therefore troubleshooting was a piece of cake. We have found vmnic3 flapping (link up, down, up, down, ...) and Fault Domain Manager (aka FDM) log message about the host isolation and VM restart.

Cool, we know the Root Cause, but what options do we have to avoid such situation?

Well, the issue described above is called Network Port Flapping and in such single port issue, in our case with vmnic3, the vmk3 (vSAN, HA heart beat) interface was originally pinned to vmnic3 and when vmnic3 went down, vmk3 was failed over from vmnic3 to vmnic1. However, because vmnic3 went up, the fail-over process was stooped and kept on vmnic3. Nevertheless, vmnic3 went down, up, down, up, etc. again and as network was very unstable, vSphere HA heart beating failed. As we do not have traditional datastores, there is no vSphere HA storage heart beating and we only rely on network heart beating which failed, thus ESXi host was claimed as isolated, and VM was Powered Off and restarted on another ESXi within vSphere cluster, where VM can provide application services running within VM again. This is actually the goal of vSphere HA, to increase VM services availability and network availability is part of the availability.

So, what is port flapping?

Source: https://lantern.splunk.com/IT_Use_Case_Guidance/Infrastructure_Performance_Monitoring/Network_Monitoring/Managing_Cisco_IOS_devices/Port_flapping_on_Cisco_IOS_devices

Port flapping is a situation in which a physical interface on the switch continually goes up and down, three or more times a second for at least 10 seconds.

Common causes for port flapping are bad, unsupported, or non-standard cable or other link synchronization issues. The cause for port flapping can be intermittent or permanent. You need a search to identify when it happens on your network so you can investigate and resolve the problem.

How to avoid port flapping consequences in vSphere Cluster?

(1) Link Dampening. There are some possibilities in Ethernet switch side. I was blogging about "Dell Force10 Link Dampening" few years ago, which should help in these situations.

(2) There is VMware vSwitch "Teaming and failover" option Failback=No available through GUI.


(3) And there is ESXi advanced setting "Net.teampolicyupdelay" which is something like "Link Dampening" described above. Source: https://kb.vmware.com/s/article/2014075

Each option above has their own benefits and drawbacks

+ means benefit

- means drawback

Let's go option by option and discuss pluses and minuses.

Option 1: Physical Ethernet switch Link Dampening

+ per physical switch port setting, therefore not too much places to set, but still some effort. Some switches supports profile configuration which can have positive impact on manageability.

- such feature might or might not be available for particular network vendor and if available, configuration varies vendor by vendor

- must be done by network admin, therefore vSphere admin does not have rights and clue about such setting and you must explain and justify it to network admin, network manager, etc.

Option 2: VMware vSwitch "Teaming and failover / Failback=No"

+ per vSwitch port group setting, therefore, single and straight forward setting in case of Distributed Virtual Switch (aka VDS)

- In case of Standard Virtual Switch (aka VSS), the setting must be done for vSwitch on each ESXi host, which has negative impact on manageability

- it will failover all trafic from flapping vmnic to fully operated vmnic, but it will never failback until ESXi restart. It has a positive impact on availability but potentially negative impact on performance and throughput

Option 3: ESXi advanced setting "Net.teampolicyupdelay"

- per ESXi advanced setting, which is not perfect from manageability point of view

+ it has a positive impact on availability and also performance, because in case of temporary flapping issue, it can failover traffic back after some longer time, lets say 5 or 10 second.

- Unfortunately, there is no such granularity like Force10 Link Dampening, which can penalize the interface based on flap frequency and decays exponentially depending on the configured half-life.

Conclusion

What option should customer implement? To be honest, it is up to cross team discussion, because each option has some advantages and disadvantages. Nevertheless, there are some options to consider to increase system availability and resiliency.

Hope you have found this write up useful. This is my give back to VMware community. I believe that sharing the knowledge is the only way how to improve not only technology but human civilization. Do you have another opinion, options or experience, please do not hesitate to write a comment below this article.

Thursday, September 02, 2021

ESXi, Intel NICs and LLDP

This will be a very short blog post because Dusan Tekeljak has already written a blog post about this topic. Nevertheless, I was not aware about such Intel NIC driver behavior which is pretty interesting, thus writing this blog post for broader awareness.

My customer who is modernizing their physical networking and implementing Cisco ACI, therefore moving from CDP (Cisco Discovery Protocol) to LLDP (Link Layer Discovery Protocol), which is industry standard. They have observed, that LLDP does not work on some NICs and after further troubleshooting, they realized it happens only on ESXi hosts with Intel X710 NIC. The NICs from other vendors (Broadcom, QLogic) worked as expected.

After some further research, they found following internet articles

and after opening this topic with server vendor (HPE), they got the following Customer Avisory

Long story short Intel NIC driver contains the "LLDP agent" which is by default enabled and consumes LLDP ethernet frames. By disabling LLDP agent within the Intel NIC driver, LLDP is not handled by NIC driver and can be observed within ESXi hypervisor, thus vSwitch network discovery via LLDP works as expected.

If you have four (4) port Intel NIC you must use following command to disable LLDP agent on all four NIC port.

esxcli system module parameters set -m i40en -p LLDP=0,0,0,0

On HPE server, this behavior can be controlled via BIOS. The feature for disabling the Link Layer Discovery Protocol (LLDP) in the BIOS/Platform Configuration (RBSU) has been included in the HPE Intel Online Firmware Upgrade released in 20 Dec 2019.

Thursday, July 15, 2021

vSAN Capacity and Performance Sizer

VMware vSAN is enterprise production-ready software-defined storage for VMware vSphere. After several (7+) years on the market, it is a proven storage technology especially for VMware Software-Defined Data Centers aka SDDC.   

As a seasoned vSphere infrastructure designer, I had a need for vSAN sizer I would trust and that was the reason to prepare just another spreadsheet with my own calculations. There are multiple VMware official vSAN and VxRail sizers, however, it is always good to have your own based on your understanding of underlying technology. It is not only about vSAN software, but also about vSphere/vSphere HA Cluster details (Admission Control HA Redundancy versus vSAN Data Protection within Storage Policy) and hardware related details like the performance difference between NAND Flash and Intel Optane Flash, NAND asymmetric read/write performance, etc. 

If you are looking for an official vSAN Sizer, go to https://vsansizer.vmware.com/

Here is the link to my UNSUPPORTED "vSAN Capacity and Performance Sizer".

Usage Instructions:

Download the excel file from the link above and start to play with yellow cells to plan your capacity and performance design.

What's unique about my vSAN sizer?

  • Detailed storage capacity calculation allowing to consider vSphere HA Admission Contro
  • Storage performance sizing for various workload pasterns with 64 kB I/O size, which is IMHO typical I/O size average in an enterprise environment
    • I/O Size 64 kB, 100% read, 100% random
    • I/O Size 64 kB, 70% read, 100% random
    • I/O Size 64 kB, 50% read, 100% random
    • I/O Size 64 kB, 30% read, 100% random
    • I/O Size 64 kB, 20% read, 100% random
    • I/O Size 64 kB, 0% read, 100% random

Disclaimer: PERFORMANCE SIZING IS VERY TRICKY!!! Over the years, I used this excel for various vSphere designs and sometimes even validated capacity and performance estimations. Based on the test results, I was tuning the calculations and parameters. However, this is always just an estimation that has to be always validated by vSphere designer responsible for a particular design.

Hope you will find this tool useful. The only ask for anybody who will use the spreadsheet for capacity and mainly performance estimations, please, give me the feedback if calculated results were close to capacity and mainly the performance you observed during your testing before putting the infrastructure into production. We all do perform test plans before production usage, right? :-) And we all know that VMware has a great synthetic storage performance test tool called HCI Bench, do not we?

Share and collaborate, this is the way we live in the VMware community!

Use comments below the blog post for further discussions.

Tuesday, June 15, 2021

vSphere 7 - ESXi boot media partition layout changes

VMware vSphere 7 is the major product release with lot of design and architectural changes. Among these changes, VMware also reviewed and changed the layout of ESXi 7 storage partitions on boot devices. Such change has some design implications which I'm trying to cover in this blog post. 

Note: Please, be aware that almost all information in this blog post are sourced from external resources such as VMware Documentation, VMware KB, VMware blog posts, and also VMware community blog posts.

Let's start with ESXi 7 Storage Requirements

Here is the list of boot device storage requirements from VMware documentation - source [2]:
  • Installing ESXi 7.0 requires a boot device that is a minimum of 8 GB for USB or SD devices, and 32 GB for other device types.
  • Upgrading to ESXi 7.0 requires a boot device that is a minimum of 4 GB. 
  • When booting from a local disk, SAN or iSCSI LUN, a 32 GB disk is required to allow for the creation of system storage volumes, which include a boot partition, boot banks, and a VMFS-L based ESX-OSData volume. 
  • The ESX-OSData volume takes on the role of the legacy /scratch partition, locker partition for VMware Tools, and core dump destination.

Key changes between ESXi 6 and ESXi 7

Here are listed key boot media partitioning changes between ESXi 6 and :
  • larger system boot partition
  • larger boot banks
  • introducing ESX OSData (ROM-data, RAM-data)
    • consolidation of coredump, tools and scratch into a single VMFS-L based ESX-OSData volume
    • coredumps default to a file in ESX-OSData
  • variable partition sizes based on boot media capacity

The biggest change to the partition layout is the consolidation of VMware Tools Locker, Core Dump and Scratch partitions into a new ESX-OSData volume (based on VMFS-L). This new volume can vary in size (up to 138GB). [4]

Official support for specifying the size of ESX-OSData has been added to the release of ESXi 7.0 Update 1c with a new ESXi kernel boot option called systemMediaSize which takes one of four values [4]:

  • min = 25GB
  • small = 55GB
  • default = 138GB (default behavior)
  • max = Consumes all available space

What is ESX OS Data partition?

ESX-OSData is new partition to store ESXi configuration, system state, and system or agent virtual machines. The OSData partition is divided into two sections 

  1. ROM-data
  2. RAM-data

ROM-data is not read/only as a name can implied, but it is a section for data written to the disk infrequently. Example of such data is VMtools ISOs, ESXi configurations, core dumps, etc.

RAM-data is for frequently written data like logs, VMFS global traces, vSAN EPD and traces, and live system state files.

How the partition layout changed? 

Below is depicted partition Lay-out in vSphere 6.x and Consolidated Partition Lay-out in vSphere 7  [1]


Partition size variations

There are various partition sizes based on boot device size. The only fix size is for the system boot partition which is always 100 MB. All other variations are depicted on picture below [1].

Note: If you use USB or SD storage devices, the ESX-OSData partition is created on an additional storage device such as an HDD or SSD. When an additional storage device is not available, ESX-OSData is created on USB or SD devices, but the ESX-OSData partition is used only to store ROM data and RAM-data are stored on a RAM disk. [1]

What design options do I have? 

ESX-OSData is used as the unified location to store Scratch, Core Dump, and ProductLocker data. By default, it is located on boot media partition (ESX-OSData) but there are advanced settings allowing these type of data relocate to external location.

Design Option #1 - Changing ScratchPartition location

In ESXi 7.0, a VMFS-L based ESX-OSData volume (where logs, coredumps and configuration are stored) replaces the traditional scratch partition. During upgrade, the configured scratch partition is converted to ESX-OSData. The settings described in VMware KB 1033696 [7] are still applicable for cases where you want to point the scratch path to another location. It is about ESXi advanced setting ScratchConfig.ConfiguredScratchLocation. I wrote the blog post about changing Scratch Location here.

Design Option #2 - Create a core dump file on a datastore

Core dump location can be also changed. To create a core dump file on a datastore, see the KB article 2077516 [8].

Design Option #3 - Changing ProductLocker location

To change productLocker location form boot media to directory on a datastore, see the VMware KB article 2129825 [10].

Applying all three options above can significantly reduce I/O operations to boot media with less endurance such as USB Flash Disk or SD Card. However, hardware industry improved over the last years and nowadays we have new boot media options such as SATA-DOM, M.2 slots for SSD, or low-cost NVMe (PCI-e SSD).

Note: I have not tested above design options in my lab, therefore, I'm assuming it works as expected based on VMware KBs reffered in each option.

Other known problems you can observe when using USB or SD media

There are other known issues with using USB or SD as a boot media, but some of these issues are already addressed or will be addressed in future patches as USB and SSD media is officially supported.
 
 I'm aware about these issues:
  • ESXi hosts experiences All Paths Down events on USB based SD Cards while using the vmkusb driver [5] [15]
    • Luciano Patrao blogged about this (or similar) issue at [14] and he has found the workaround until the final VMware fix which should be released in ESXi 7.0 U3. The Luciano's workaround is to 
      1. login to ESXi console (SSH or DCUI)
      2. execute command "esxcfg-rescan -d vmhba32" several times until it finishes without an error.
      3. You need to give some minutes between each time you rerun the command. Be patient and try again in 2/5m.
      4. After all, errors are gone and the command finishes without any error, you should see in logs that “mpx.vmhba32:C0:T0:L0” was mounted in rw mode, and you should be able to do some work on the ESXi hosts again.
      5. If you still have some issues, restart the management agents
        • /etc/init.d/hostd restart
        • /etc/init.d/vpxa restart   
      6. After this, you should be able to migrate your VMs to another ESXi host and reboot this one. Until it breaks again in case someone is trying to use VMtools.
  • VMFS-L Locker partition corruption on SD cards in ESXi 7.0 U1 and U2 [6] (should be fixed in future ESXi patch)
  • High frequency of read operations on VMware Tools image may cause SD card corruption [12]
    • This issue has been addressed in ESXi 6.7 U3 - changes were made to reduce the number of read operations being sent to the SD card, an advanced parameter was introduced that allows you to migrate your VMware tools image to ramdisk on boot . This way, the information is read only once from the SD card per boot cycle.
      • However, it seems that problem reoccurred in ESXi 7.x, because ToolsRamdisk option is not available with ESXi 7.0.x releases [13]
    • The other vSphere design solution is IMHO the change of ProductLocker location mentioned above, because VMtools image is not located on boot media.

Conclusion

ESXi 7 is using ESX-OSData partition for various logging and debugging files. In addition, if vSAN and/or NSX is enabled in ESXi, there are additional trace files leading into even higher I/O. This ESXi system behavior requires higher endurance of boot media than in the past. 

If you are defining the new hardware specification, it is highly recomended to use larger boot media (~150 GB or more) based on NAND flash technology and connected through modern buses like M.2 or PCI-e. When larger boot media is in use, ESXi 7 will do all the magic required for correct partitioning of ESX boot media.

In case of existing hardware and no budget for additional hardware upgrade, you can still use SD cards or USB drives, but you should carefully design boot media layout and consider relocation of Scratch, Core Dump, and ProductLocker to external locations to mitigate the risk of boot media failure.

Hope this write-up helps and if you will have some other finding or comment do not hesitate to let me know via comments bellow the post, twitter or email.

Sources:

Saturday, May 15, 2021

AWS, FreeBSD AMIs and WebScale application FlexBook

I've started to play with AWS cloud computing. When I'm starting with any new technology, the best way how to learn it, is to use it for some project. And because I participate in one open-source project, where we develop multi-cloud application which can run, scale and auto migrate among various cloud providers, I've decided to do a Proof of Concept in AWS. 

The open-source software I'm going to deploy is FlexBook and is available on GitHub.

Below is the logical infrastructure design of AWS infrastructure for deployment of webscale application.

My first PoC is using following AWS resources

  • 1x AWS Region
  • 1x AWS VPC
  • 1x AWS Availability Zone
  • 1x AWS Internet Gateway
  • 1x AWS Public Segment
  • 1x AWS Private Segment
  • 1x AWS NAT Gateway
  • 6x EC Instances
    • 1x FlexBook Ingress Controller - NGINX used as L7 load balancer redirecting ingress traffic to particualar FlexBook node
    • 1x WebPortal - NGINX used as web server for static portal page using JavaScript components leveraging REST API communication to FlexBook cluster (3 FlexBook nodes which can auto scale if necessary)
    • 1x FlexBook Manager - responsible for FlexBook cluster management including deployment, auto-scale, application distributed resource management, etc.
    • 3x FlexBook Node - this is where multi-tenant FlexBook application is running. App tenants can be migrated across FlexBook nodes.

For all EC2 instances I'm going to use my favorite operating system - FreeBSD.

I've realized, that AWS EC2 instances do not support console access, therefore, ssh is the only way how to log in to servers. You can generate SSH Key Pair during EC2 deployment and download private key (PEM) to your computer. AWS shows you how to connect to your EC2 instance. This is what you see in instructions:

ssh -i "flxb-mgr.pem" root@ec2-32-7-14-5.eu-central-1.compute.amazonaws.com

However, command above does not work for FreeBSD. AWS tells you following information ...

Note: In most cases, the guessed user name is correct. However, read your AMI usage instructions to check if the AMI owner has changed the default AMI user name. 
And that's the point. The default username for FreeBSD AWS AMIs is ec2-user, therefore, following command will let you connect to AWS EC2 FreeBSD instance.

ssh -i "flxb-mgr.pem" ec2-user@ec2-32-7-14-5.eu-central-1.compute.amazonaws.com

When you SSH to the ec2-user, you can su to a root account which does not have any password.

Here are best practices for production usage

  • set a root password
  • remove the ec2-user account and create your own account with your SSH own keys

That's it for now. I will continue with AWS discovery and potential production use of AWS for some FlexBook projects. 

 Sources and additional resources:

Wednesday, March 24, 2021

What's new in vSphere 7 Update 2

vSphere 7 is not only about server virtualization (Virtual Machines) but also about Containers orchestrated by Kubernetes orchestration engine. VMware Kubernetes distribution and the broader platform for modern applications, also known as CNA - Cloud Native Applications or Developer Ready Infrastructure) is called VMware Tanzu. Let's start with enhancements in this area and continue with more traditional areas like Operational, Scalability, and Security improvements.

Developer Ready Infrastructure

vSphere with Tanzu - Integrated LoadBalancer

vSphere Update 2 includes fully supported, integrated, highly available, enterprise-ready Load Balancer for Tanzu Kubernetes Grid Control Plane and Kubernetes Services of type Load Balancer - NSX Advanced Load Balancer Essentials (Formerly Avi Load Balancer). NSX Advanced Load Balancer Essentials is scale out load balancer. The data path for users accessing the VIPs is through a set of Service Engines that automatically scale out as workloads increase.

Sphere with Tanzu - Private Registry Support

If you are using a container registry with self-signed, or private CA signed certs – this allows them to be used with TKG clusters.

Sphere with Tanzu - Advanced security for container-based workloads in vSphere with Tanzu on AMD

For customers interested in running containers with as much security in place as possible, Confidential Containers provides full and complete register and memory isolation and encryption from Pod to Pod and Hypervisor to Pod.

  • Builds on vSphere’s industry-leading, easy-to-enable support for AMD SEV-ES data protections on 2nd & 3rd generation AMD EPYC CPUs
  • Each Pod is uniquely encrypted to protect applications and data in use within CPU and memory
  • Enabled with standard Kubernetes YAML annotation

Artificial Intelligence & Machine Learning

vSphere and NVIDIA. The new Ampere family of NVIDIA GPUs is supported on vSphere 7U2. This is part of a bigger effort between the two companies to build a full stack AI/ML offering for customers.

  • Support for new NVIDIA Ampere family of GPUs
    • In the new Ampere family of GPUs, the A100 GPU is the new high-end offering. Previously the high-end GPU was the V100 – the A100 is about double the performance of the V100. 
  • Multi-Instance GPU (MIG) improves physical isolation between VMs & workloads
    • You can think of MIG as spatial  separation as opposed to the older form of vGPU which did time-slicing to separate one VM from another on the GPU. MIG is used through a familiar vGPU profile assigned to the VM. You enable MIG at the vSphere host level firstly using one simple command "nvidia-smi mig enable -I 0". This requires SR-IOV to be switched on in the BIOS (via the iDRAC on a Dell server, for example).  
  • Performance enhancements with GPUdirect & Address Translation Service in the hypervisor

Operational Enhancements

VMware vSphere Lifecycle Manager - support for Tanzu & NSX-T

  • vSphere Lifecycle Manager now handles vSphere with Tanzu “supervisor” cluster lifecycle operations
  • Uses declarative model for host management

VMware vSphere Lifecycle Manager Desired Image Seeding

Extract an image from an existing host

ESXi Suspend-to-Memory

Suspend to Memory introduces a new option to help reduce the overall ESXi host upgrade time.

  • Depends on Quick Boot
  • New option to suspend the VM state to memory during upgrades
  • Options defined in the Host Remediation Settings
  • Adds flexibility and reduces upgrade time

Availability & Efficiency

vSphere HA support for Persistent Memory Workloads

  • Use vSphere HA to automatically restart workloads with PMEM
  • Admission Control ensures NVDIMM failover capacity
  • Can be enabled with VM Hardware 19

Note: By default, vSphere HA will not attempt to restart a virtual machine using NVDIMM on another host. Allowing HA on host failure to failover the virtual machine, will restart the virtual machine on another host with a new, empty NVDIMM

VMware vMotion Auto Scale

vSphere 7 U2 automatically tunes vMotion to the available network bandwidth for faster live-migrations for faster outage avoidance and less time spent on maintenance.

  • Faster live migration on 25, 40, and 100 GbE networks means faster outage avoidance and less time spent on maintenance
  • One vMotion stream capable of processing 15 Gbps+
  • vMotion automatically scales the number of streams to the available bandwidth
  • No more manual tuning to get the most from your network

VMware vMotion Auto Scale

AMD optimizations

As customers trust in AMD increases, so is the performance of ESXi on modern AMD processors.

  • Optimized scheduler ​for AMD EPYC architecture
  • Better load balancing and cache locality
  • Enormous performance gains

Reduced I/O Jitter for Latency-sensitive Workloads

Under the hood vSphere kernel improvements in vSphere 7U2 allow for significantly improved I/O latency for virtual Telco 5G Radio Access Networks (vRAN) deployments.

  • Eliminate Jitter for Telco 5G Deployments
  • Significantly Improve I/O Latency
  • Reduce NIC Passthrough Interrupts

Security & Compliance

ESXi Key Persistence

ESXi Key Persistence helps eliminate dependency loops and creates options for encryption without the traditional infrastructure. It’s the ability to use a Trusted Platform Module, or TPM, on a host to store secrets. A TPM is a secure enclave for a server, and we strongly recommend customers install them in all of their servers because they’re an inexpensive way to get a lot of advanced security.

  • Helps Eliminate Dependencies
  • Enabled via Hardware TPM
  • Encryption Without vCenter Server

VMware vSphere Native Key Provider 

vSphere Native Key Provider puts data-at-rest protections in reach for all customers.

  • Easily enable vSAN Encryption, VM Encryption, and vTPM
  • Key provider integrated in vCenter Server & clustered ESXi hosts
  • Works with ESXi Key Persistence to eliminate dependencies
  • Adds flexible and easy-to-use options for advanced data-at-rest security
 vSphere has some pretty heavy-duty data-at-rest protections, like vSAN Encryption, VM encryption, and virtual TPMs for workloads. One of the gotchas there is that customers need a third-party key provider to enable those features, traditionally known as a key management service or KMS. There are inexpensive KMS options out there but they add significant complexity to operations. In fact, complexity has been a real deterrent to using these features… until now!

Storage

iSCSI path limits
 
ESXi has had a disparity in path limits between iSCSI and Fibre Channel. 32 paths for FC and 8 (8!) paths for iSCSI. As of ESXi 7.0 U2 this limit is now 32 paths. For further details read this.

File Repository on a vVol Datastore

VMware added a new feature that supports creating a custom size config vVol–while this was technically possible in earlier releases, it was not supported. For further details read this.

VMware Tools and Guest OS

Virtual Trusted Platform Module (vTPM) support on Linux & Windows

  • Easily enable in-guest security requiring TPM support
  • vTPM available for modern versions of Microsoft Windows and select Linux distributions
  • Does not require physical TPM
  • Requires VM Encryption, easy with Native Key Provider!

VMware Tools Guest Content Distribution

Guest store enables the customers to distribute various types of content to the VMs, like an internal CDN system.

  • Distribute content “like an internal CDN”
  • Granular control over participation
  • Flexibility to choose content

VMware Time Provider Plugin for Precision Time on Windows

With the introduction of new plugin: vmwTimeProvider shipped with VMware Tools, guests can synchronize directly with hosts over a low-jitter channel.

  • VMware Tools plugin to synchronize guest clocks with Windows Time Service
  • Added via custom install option in VMware Tools
  • Precision Clock device available in VM Hardware 18+
  • Supported on Windows 10 and Windows Server 2016+
  • High quality alternative to traditional time sources like NTP or Active Directory

Conclusion

vSphere 7 Update 2 is nice evolution of vSphere platform. If you ask me what is the most interesting feature in this release, I would probably answer VMware vSphere Native Key Provider, because it has a positive impact on manageability and simplification of overall architecture. The second one is VMware vMotion Auto Scale, which reduces operational time during ESXi maintenace operations in environments with 25+ Gb NICs already adopted.