Thursday, March 17, 2022

vSAN Health Service - Network Health - vSAN: MTU check

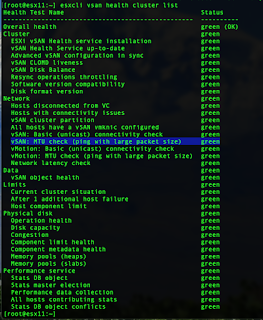
I have a customer having an issue with vSAN Health Service - Network Health - vSAN: MTU check which was, from time to time, alerting the problem. Normally, the check is green as depicted in the screenshot below.

The same can be checked from CLI via esxcli.

However, my customer was experienced intermittent yellow and red alerts and the only way was to retest the skyline test suite. After retesting, sometimes it switched back to green, sometimes not.

During the problem isolation was identified that the only problem is on vSAN clusters having witness nodes (2-node clusters, stretched clusters). Another indication was that the problem was identified only between vSAN data nodes and vSAN witness. The network communication between data nodes was always ok.

How is this particular vSAN health check work?

It is important to understand, that “vSAN: MTU check (ping with large packet size)”

  • is not using “don’t fragment bit” to test end-to-end MTU configuration
  • is not using manually reconfigured (decreased) MTU from vSAN witness vmkernel interfaces leveraged in my customer's environment. The check is using static large packet size to understand how the network can handle it.
  • The check is sending the large packet between ESXi (vSAN Nodes) and evaluates packet loss based on the following thresholds:
    • 0% <-> 32% packet loss => green
    • 33%  <-> 66% packet loss => yellow
    • 67%  <-> 100% packet loss => red
The vSAN health check is great to understand if there is a network problem (packet loss) between vSAN data nodes. The potential problem can be on ESXi hosts or somewhere in the network path.

So what's the problem?

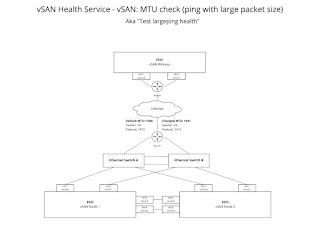
Let's visualize the environment architecture which is depicted in the drawing below.


The customer has vSAN witness in a remote location and experiencing the problem only between vSAN data nodes and vSAN witness node. Large packet size ping (ping -s 8000) to vSAN witness was tested from ESXi console to test if packet loss is observed there as well.  As we have observed the packet loss, it was the indication, that the problem is somewhere in the middle of the network. Some network routers could be overloaded and do not provide fast enough packet fragmentation causing packet loss.

Feature Request

My customer understands that this is the correct behavior, and everything works as is designed. However, as they have a large number of vSAN clusters, they would highly appreciate, if the check "vSAN: MTU check (ping with large packet size)" would be separated into two independent tests.
  • Test #1: “vSAN: MTU check (ping with large packet size) between data nodes”
  • Test #2: “vSAN: MTU check (ping with large packet size) between data nodes and witness”
We believe that such functionality would significantly improve the operational experience for large and complex environments.

Hope this explanation helps someone else within the VMware community.

Thursday, March 03, 2022

How to get vSAN Health Check state in machine-friendly format

I have a customer with dozens of vSAN clusters managed and monitored by vRealize Operations (aka vROps). vROps has a management pack for vSAN but there are not all features my customer is expecting for day-to-day operations. vSAN has a great feature called vSAN Skyline Health which is essentially a test framework periodically checking the health of vSAN state. Unfortunately, vSAN Skyline Health is not integrated with vROps which might or might not change in the future. Nevertheless, my customer has to operate vSAN infrastructure today, therefore, we are investigating some possibilities for how to develop some custom integration between vSAN Skyline Health and vROps.

The first thing we have to solve is how to get vSAN Skyline Health status in some machine-friendly format. It is well known that vSAN is manageable via esxcli.

Using ESXCLI output

Many ESXCLI commands generate the output you might want to use in your application. You can run esxcli with the --formatter dispatcher option and send the resulting output as input to a custom parser script.

Below are ESXCLI commands to get vSAN HealthCheck status.

esxcli vsan health cluster list
esxcli --formatter=keyvalue vsan health cluster list
esxcli --formatter=xml vsan health cluster list

Option formatter can help us to get the output in machine-friendly formats for automated processing.

If we want to get a detailed Health Check description we can use the following command

esxcli vsan health cluster get -t "vSAN: MTU check (ping with large packet size)"

Option -t contains the name of a particular vSAN HealthCheck test.

Example of one vSAN Health Check:

[root@esx11:~] esxcli vsan health cluster get -t "vSAN: MTU check (ping with large packet size)"

vSAN: MTU check (ping with large packet size) green
Performs a ping test with large packet size from each host to all other hosts.
Ask VMware: http://www.vmware.com/esx/support/askvmware/index.php?eventtype=com.vmware.vsan.health.test.largepin...
Only failed pings
From Host To Host To Device Ping result
--------------------------------------------------------
Ping results
From Host To Host To Device Ping result
----------------------------------------------------------------------
192.168.162.111 192.168.162.114 vmk0 green
192.168.162.111 192.168.162.113 vmk0 green
192.168.162.111 192.168.162.112 vmk0 green
192.168.162.112 192.168.162.111 vmk0 green
192.168.162.112 192.168.162.113 vmk0 green
192.168.162.112 192.168.162.114 vmk0 green
192.168.162.113 192.168.162.114 vmk0 green
192.168.162.113 192.168.162.112 vmk0 green
192.168.162.113 192.168.162.111 vmk0 green
192.168.162.114 192.168.162.111 vmk0 green
192.168.162.114 192.168.162.112 vmk0 green
192.168.162.114 192.168.162.113 vmk0 green

Conclusion

This very quick exercise shows the way how to programmatically get vSAN Skyline Health status via ESXCLI and somehow parse it and leverage vROps REST API to insert these data into vSAN Cluster objects as metrics. There is PowerShell/PowerCLI way how to leverage ESXCLI and do some custom automation, however, it is out of the scope of this blog post.  

Tuesday, March 01, 2022

Linux virtual machine - disk.EnableUUID

I personally prefer FreeBSD operating system to Linux, however, there are applications which is better to run on top of Linux. When playing with Linux, I usually choose Ubuntu. After fresh Ubuntu installation, I realized a lot of entries within log (/var/log/syslog) which is annoying. 

Mar  1 00:00:05 newrelic multipathd[689]: sda: add missing path
Mar  1 00:00:05 newrelic multipathd[689]: sda: failed to get udev uid: Invalid argument
Mar  1 00:00:05 newrelic multipathd[689]: sda: failed to get sysfs uid: Invalid argument
Mar  1 00:00:05 newrelic multipathd[689]: sda: failed to get sgio uid: No such file or directory
Mar  1 00:00:10 newrelic multipathd[689]: sda: add missing path
Mar  1 00:00:10 newrelic multipathd[689]: sda: failed to get udev uid: Invalid argument
Mar  1 00:00:10 newrelic multipathd[689]: sda: failed to get sysfs uid: Invalid argument
Mar  1 00:00:10 newrelic multipathd[689]: sda: failed to get sgio uid: No such file or directory

It is worth mentioning that Ubuntu Linux is the Guest OS within a virtual machine running on top of VMware vSphere Hypervisor (ESXi host).

After a quick googling I have found several articles with the solution ...
The solution is very simple ...

The problem is that VMWare by default doesn't provide the information needed by udev to generate /dev/disk/by-id entries. The resolution is to put 
 disk.EnableUUID = "TRUE"  
into VM advanced settings.

If you use vSphere Client connected to vCenter, you have to 
  1. Power Off particular Virtual Machine
  2. Go to Virtual Machine -> Edit Settings
  3. Select tab VM Options
  4. Expand Advanced section
  5. Click EDIT CONFIGURATION
  6. Add New Configuration Parameter (disk.EnableUUID with the value TRUE)
  7. Save the advanced settings
  8. Power On Virtual machine
Below are screenshots from my home lab ...


Hope this helps someone else within the VMware community.