Wednesday, July 06, 2022

Monolithic versus Microservices application architecture consideration

Microservices application architecture is very popular nowadays, however, it is important to understand that everything has advantages and drawbacks. I absolutely understand advantages of micro-services application architecture, however, there is at least one drawback. Of course, there are more, but let's show at least the potential impact on performance. The performance is about latency.

Monolithic application calls functions (aka procedures) locally within a single compute node memory (RAM). Latency of RAM is approximately 100 ns (0.0001 ms) and Python function call in decent computer has latency ~370 ns (0.00037 ms). Note: You can test Python function latency in your computer with the code available at https://github.com/davidpasek/function-latency/tree/main/python

Microservices application is using remote procedure calls (aka RPC) over network. Typically as REST or gRPC call over https, therefore, it has to traverse the network. Even the latency of modern 25GE Ethernet network is approximately 480 ns (0.00048 ms is still 5x slower than latency of RAM), and RDMA over Converged Ethernet latency can be ~3,000 ns (0.003 ms), the latency of microservice gRPC function call is somewhere between 40 and 300 ms. [source

Conclusion

Python local function call latency is ~370 ns. Python remote function call latency is ~280 ms. That's the order of magnitude (10^6) higher latency of micro-services application. RPC in low-level programming languages like C++ can be 10x faster, but it is still 10^5 slower than local Python function call.

I'm not saying that micro-services application is bad. I just recommend to consider this negative impact on performance during your application design and specification of application services.

Thursday, June 16, 2022

Grafana - average size of log line

As I'm currently participating on Grafana observability stack Plan & Design exercise, I would like to know what is the average size of log line ingested into the observability stack. Such information is pretty useful for capacity planning and sizing.

Log lines are stored on Loki log database and Loki itself is exposing metrics into Mimir time series database for self monitoring purpose. Grafana Loki and Promtail metrics are documented here.

The following formula calculates average size of log message:

sum(rate(loki_distributor_bytes_received_total [7d])) / sum(rate(loki_distributor_lines_received_total [7d]))

The result is visualized in the screenshot below.

 Hope this tip will be useful for someone else.

Tuesday, April 26, 2022

Farewell VMware

The clever people and Buddhists know that the only constant thing in the world is change. The change is usually associated with transition, and as we all know, transitions are not easy, but generally good and inevitable things. All transitions are filled with anticipation and potential risks, however, any progress and innovations are only achieved by accepting the risk and going outside of the comfort zone. That's one of the reasons I have decided to leave VMware, even though VMware organization and technologies are very close to my heart, and I truly believe that the VMware software stack is one of the most important IT technology stacks for the future of humans. 

As I prepare to move on, I have to say goodbye and a big thank you to the VMware organization. VMware technologies are part of my daily life for a long time, using the technology since 2006, and I’ll really miss the VMware family I joined back in 2015. It was a great time, and I will especially miss VMware core technical folks transforming the industry and building one of the best software-defined infrastructure stacks humans have done so far. 

And where do I actually go? Back in 2001, I was the co-founder of the software start-up, where I started my professional career by architecting, developing, and operating the air ticket online booking platform, which was later acquired by Galileo Travelport https://www.travelport.com. Now, after 20 years, I have got the proposal to help Kiwi.com to become the # 1 digital system in the modern digitalized travel industry. For those who do not know Kiwi.com, Kiwi.com was originally a Czech start-up growing into a worldwide #3 air ticketing booking platform. They were acquired by General Atlantic back in 2019 https://www.generalatlantic.com/media-article/general-atlantic-announces-strategic-partnership-with-travel-platform-kiwi-com/, and General Atlantic’s past and current investments in the global online travel industry include Priceline, Airbnb, Meituan, Flixbus, Uber, Despegar, Smiles and Mafengwo can tell you where the online travel industry is heading. Those who can read between the lines understand that such a mix allows to build optimal door-to-door traveling for the next human generation(s). I have decided that I would like to be part of such travel industry transformation! Not only because Kiwi.com really does multi-cloud with Kubernetes at a large scale, but mainly to be part of a very young, innovative, and inspiring team including hundreds of software developers and dozens of infrastructure platform and DevOps engineers operating everything as cloud computing.

I'm expecting big fun and you can expect more blog posts about DevOps, multi-cloud, Docker, Kubernetes, CI/CD, Observability, and infrastructure for modern applications because I have to learn and test a lot of new technologies and writing the blog post is the great way to share new knowledge and getting the feedback from other folks in various communities.

Hope my blog will be still useful for my current readers who are typically very IT infrastructure-oriented, however, the software eats the world, and the IT infrastructure is here to support software, isn't it? 

Sunday, April 03, 2022

VMware vSphere DRS/DPM and iDRAC IPMI

I have four Dell server R620 in my home lab. I'm running some workloads which have to run 24/7 (DNS/DHCP server, Velocloud SD-WAN gateway, vCenter Server, etc.), however,  there are other workloads just for testing and Proof of Concepts purposes. These workloads are usually powered off. As electricity costs will most probably increase in near future, I realized VMware vSphere DRS/DPS (Distributed Resource Scheduler/Distributed Power Management) could be a great technology to keep the bill of electricity at an acceptable level.

VMware vSphere DPM is using IPMI protocol to manage physical servers. IPMI has to be configured per ESXi server as depicted in the screenshot below.

I have iDRAC Enterprise in my Dell servers and I thought it will be a simple task to configure iDRAC by just entering the iDRAC username, password, IP address, and MAC address.

However, I have realized that the configuration operation fails with an error message "A specified parameter was not correct: ipmiInfo".


During troubleshooting, I tested ipmi (ipmitool -I lanplus -H 192.168.4.222 -U root -P calvin chassis status) from FreeBSD operating system, and I have realized it does not work as well.

That led me to do some further research and to find, that iDRAC doesn't have IPMI enabled by default. iDRAC command to get the IPMI status is "racadm get iDRAC.IPMILan"

iDRAC command "racadm set iDRAC.IPMILan.Enable 1" enables IPMI over LAN and the command "racadm get iDRAC.IPMILan" can be used to validate the IPMI over LAN status.

After such iDRAC configuration, I was able to use IPMI from FreeBSD operating system.

And it worked correctly in VMware vSphere as well as depicted in the screenshot below. 


When IPMI is configured correctly on ESXi, the ESXi host can be switched into Standby Mode manually from vSphere Client as ESXi action.   


The ESXi Standby Mode is used for vSphere DRS/DPM automation. 


Job done!

Hope this helps some other folks in the VMware community.

Thursday, March 17, 2022

vSAN Health Service - Network Health - vSAN: MTU check

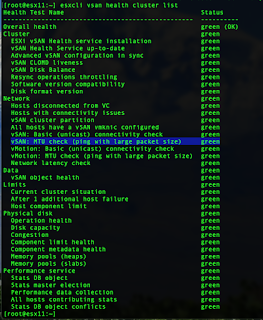
I have a customer having an issue with vSAN Health Service - Network Health - vSAN: MTU check which was, from time to time, alerting the problem. Normally, the check is green as depicted in the screenshot below.

The same can be checked from CLI via esxcli.

However, my customer was experienced intermittent yellow and red alerts and the only way was to retest the skyline test suite. After retesting, sometimes it switched back to green, sometimes not.

During the problem isolation was identified that the only problem is on vSAN clusters having witness nodes (2-node clusters, stretched clusters). Another indication was that the problem was identified only between vSAN data nodes and vSAN witness. The network communication between data nodes was always ok.

How is this particular vSAN health check work?

It is important to understand, that “vSAN: MTU check (ping with large packet size)”

  • is not using “don’t fragment bit” to test end-to-end MTU configuration
  • is not using manually reconfigured (decreased) MTU from vSAN witness vmkernel interfaces leveraged in my customer's environment. The check is using static large packet size to understand how the network can handle it.
  • The check is sending the large packet between ESXi (vSAN Nodes) and evaluates packet loss based on the following thresholds:
    • 0% <-> 32% packet loss => green
    • 33%  <-> 66% packet loss => yellow
    • 67%  <-> 100% packet loss => red
The vSAN health check is great to understand if there is a network problem (packet loss) between vSAN data nodes. The potential problem can be on ESXi hosts or somewhere in the network path.

So what's the problem?

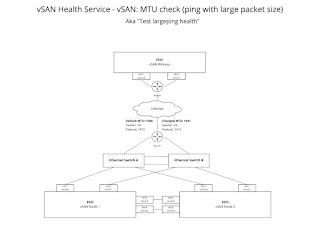
Let's visualize the environment architecture which is depicted in the drawing below.


The customer has vSAN witness in a remote location and experiencing the problem only between vSAN data nodes and vSAN witness node. Large packet size ping (ping -s 8000) to vSAN witness was tested from ESXi console to test if packet loss is observed there as well.  As we have observed the packet loss, it was the indication, that the problem is somewhere in the middle of the network. Some network routers could be overloaded and do not provide fast enough packet fragmentation causing packet loss.

Feature Request

My customer understands that this is the correct behavior, and everything works as is designed. However, as they have a large number of vSAN clusters, they would highly appreciate, if the check "vSAN: MTU check (ping with large packet size)" would be separated into two independent tests.
  • Test #1: “vSAN: MTU check (ping with large packet size) between data nodes”
  • Test #2: “vSAN: MTU check (ping with large packet size) between data nodes and witness”
We believe that such functionality would significantly improve the operational experience for large and complex environments.

Hope this explanation helps someone else within the VMware community.

Thursday, March 03, 2022

How to get vSAN Health Check state in machine-friendly format

I have a customer with dozens of vSAN clusters managed and monitored by vRealize Operations (aka vROps). vROps has a management pack for vSAN but there are not all features my customer is expecting for day-to-day operations. vSAN has a great feature called vSAN Skyline Health which is essentially a test framework periodically checking the health of vSAN state. Unfortunately, vSAN Skyline Health is not integrated with vROps which might or might not change in the future. Nevertheless, my customer has to operate vSAN infrastructure today, therefore, we are investigating some possibilities for how to develop some custom integration between vSAN Skyline Health and vROps.

The first thing we have to solve is how to get vSAN Skyline Health status in some machine-friendly format. It is well known that vSAN is manageable via esxcli.

Using ESXCLI output

Many ESXCLI commands generate the output you might want to use in your application. You can run esxcli with the --formatter dispatcher option and send the resulting output as input to a custom parser script.

Below are ESXCLI commands to get vSAN HealthCheck status.

esxcli vsan health cluster list
esxcli --formatter=keyvalue vsan health cluster list
esxcli --formatter=xml vsan health cluster list

Option formatter can help us to get the output in machine-friendly formats for automated processing.

If we want to get a detailed Health Check description we can use the following command

esxcli vsan health cluster get -t "vSAN: MTU check (ping with large packet size)"

Option -t contains the name of a particular vSAN HealthCheck test.

Example of one vSAN Health Check:

[root@esx11:~] esxcli vsan health cluster get -t "vSAN: MTU check (ping with large packet size)"

vSAN: MTU check (ping with large packet size) green
Performs a ping test with large packet size from each host to all other hosts.
Ask VMware: http://www.vmware.com/esx/support/askvmware/index.php?eventtype=com.vmware.vsan.health.test.largepin...
Only failed pings
From Host To Host To Device Ping result
--------------------------------------------------------
Ping results
From Host To Host To Device Ping result
----------------------------------------------------------------------
192.168.162.111 192.168.162.114 vmk0 green
192.168.162.111 192.168.162.113 vmk0 green
192.168.162.111 192.168.162.112 vmk0 green
192.168.162.112 192.168.162.111 vmk0 green
192.168.162.112 192.168.162.113 vmk0 green
192.168.162.112 192.168.162.114 vmk0 green
192.168.162.113 192.168.162.114 vmk0 green
192.168.162.113 192.168.162.112 vmk0 green
192.168.162.113 192.168.162.111 vmk0 green
192.168.162.114 192.168.162.111 vmk0 green
192.168.162.114 192.168.162.112 vmk0 green
192.168.162.114 192.168.162.113 vmk0 green

Conclusion

This very quick exercise shows the way how to programmatically get vSAN Skyline Health status via ESXCLI and somehow parse it and leverage vROps REST API to insert these data into vSAN Cluster objects as metrics. There is PowerShell/PowerCLI way how to leverage ESXCLI and do some custom automation, however, it is out of the scope of this blog post.  

Tuesday, March 01, 2022

Linux virtual machine - disk.EnableUUID

I personally prefer FreeBSD operating system to Linux, however, there are applications which is better to run on top of Linux. When playing with Linux, I usually choose Ubuntu. After fresh Ubuntu installation, I realized a lot of entries within log (/var/log/syslog) which is annoying. 

Mar  1 00:00:05 newrelic multipathd[689]: sda: add missing path
Mar  1 00:00:05 newrelic multipathd[689]: sda: failed to get udev uid: Invalid argument
Mar  1 00:00:05 newrelic multipathd[689]: sda: failed to get sysfs uid: Invalid argument
Mar  1 00:00:05 newrelic multipathd[689]: sda: failed to get sgio uid: No such file or directory
Mar  1 00:00:10 newrelic multipathd[689]: sda: add missing path
Mar  1 00:00:10 newrelic multipathd[689]: sda: failed to get udev uid: Invalid argument
Mar  1 00:00:10 newrelic multipathd[689]: sda: failed to get sysfs uid: Invalid argument
Mar  1 00:00:10 newrelic multipathd[689]: sda: failed to get sgio uid: No such file or directory

It is worth mentioning that Ubuntu Linux is the Guest OS within a virtual machine running on top of VMware vSphere Hypervisor (ESXi host).

After a quick googling I have found several articles with the solution ...
The solution is very simple ...

The problem is that VMWare by default doesn't provide the information needed by udev to generate /dev/disk/by-id entries. The resolution is to put 
 disk.EnableUUID = "TRUE"  
into VM advanced settings.

If you use vSphere Client connected to vCenter, you have to 
  1. Power Off particular Virtual Machine
  2. Go to Virtual Machine -> Edit Settings
  3. Select tab VM Options
  4. Expand Advanced section
  5. Click EDIT CONFIGURATION
  6. Add New Configuration Parameter (disk.EnableUUID with the value TRUE)
  7. Save the advanced settings
  8. Power On Virtual machine
Below are screenshots from my home lab ...


Hope this helps someone else within the VMware community. 

Sunday, January 23, 2022

What FreeBSD type of NIC to use in VMware Virtual Machine?

Today, I have received a question from one of my readers based in Germany. Hellmuth has the following question ...

Hi,

i just stumbled across your blog and read that you use FreeBSD.

For a long time, I wondered what to choose as the „best“ guest driver for FreeBSD: em, the vmx in the FreeBSD source, or the kld which comes with the open VMware Tools ?

Do you have an idea ? What do you use ?

Best regards,

Hellmuth

So here is the answer to Hellmuth and I believe, the answer can help somebody else in VMware and FreeBSD communities.

Thursday, January 20, 2022

Energetics and Distributed Cloud Computing

The Energy

The cost of energy is increasing. A significant part of electrical energy cost is the cost of distribution. That's the reason why the popularity of small home solar systems increases. That's the way how to generate and consume electricity locally and be independent of the distribution network. However, we have a problem. "Green Energy" from solar, wind, and hydroelectric power stations is difficult to distribute via the electrical grid. Energy accumulation (batteries, pumped storage power plant, etc.) is costly and for the traditional electrical grid is very difficult to automatically manage the distribution of so many energy sources. 

The Cloud Computing

The demand for cloud (computing and storage) capacity is increasing year by year. Internet bandwidth increases and cost decreases every year. 5G Networks and SD-WANs are on the radar. Cloud Computing is operated on data centers. A significant part of data center costs is the cost of energy. 

The potential synergy between Energetics and Cloud Computing 

The solution is to consume electricity in the proximity of green power generators. Excess electricity is accumulated into batteries but batteries capacity is limited. We should treat batteries like a cache or buffer to overcome times when green energy does not generate energy but we have local demand. However, when we have excess electricity and the battery (cache/buffer) is full, instead of providing the energy into the electrical grid, the excess electricity can be consumed by a computer system providing compute resources to cloud computing consumers over the internet. This is the form of Distributed Cloud Computing. 

Cloud-Native Applications

So, let's assume we will have Distributed Cloud Computing with so-called Spot Compute Resource Pools". Spot Compute Resource Pools are computing resources that can appear or disappear within hours or minutes. This is not optimal IT infrastructure for traditional software applications which are not infrastructure aware. For such distributed cloud computing the software applications must be designed and developed with infrastructure resources ephemerality in mind. In other words, Cloud-Native Applications must be able to leverage ephemeral compute resource pools and know how to use "Spot Compute Resource Pools".

Conclusion

With today's technology, it is not very difficult to roll out such a network of data centers providing distributed cloud computing and consuming locally the excess electricity from "green" electric sources. I'm planning the Proof of Concept in my house in the middle of this year and let you know about some real experiences because the devil is in detail.

The conceptual Design of such a solution is available at https://www.slideshare.net/davidpasek/flex-cloud-conceptual-design-ver-02

If you would like to discuss this topic, do not hesitate to use the comments below the blog post or open discussion on Twitter @vcdx200.

Wednesday, January 19, 2022

How to avoid or at least mitigate the risk of software and hardware component failures?

Last Thursday, my Firefox web browser stopped working at a regular zoom meeting with my team. Today, thanks to The Register, I realized that it was due to a Foxstuck software bug. For further details about the bug read https://www.theregister.com/2022/01/18/foxstuck_firefox_browser_bug_boots/ 

My troubleshooting was pretty quick. Both Chrome and Safari worked fine, so it was evident that this was definitely the Firefox issue.

I tried various classic tricks to solve the Firefox problem (clearing the cache, cookies, reinstalling the software to the latest version, etc.), but because nothing helped in the 10 minutes I was willing to invest, I decided I didn't have time for further experiments and after about a year of using Firefox, I switched back to Chrome.

The switch over was all about transferring important data from Firefox to Chrome. I use an external password manager (thank god), so the only important data in Firefox were my bookmarks. Exporting bookmarks from Firefox and importing them into Chrome was a matter of seconds.

Problem solved. Hurrah!

But, it's clear that a similar software bug may hit Chrome or Safari in the future, so it's only a matter of time before I will be forced to switch to another web browser. Actually, Chrome has made me angry in the past and that was the reason to switch to Firefox.

So what is the moral of this story?

The only way not to be affected by such software bugs is dual, triple, or even multi-vendor strategy (in this case Firefox, Chrome, Safari) and the art of quickly identifying a problematic component and replacing it with another.

This blog is about data centers, data center infrastructure, and software-defined infrastructure. Does it apply here? I think so.

In the hardware area, we can solve the MULTI-VENDOR strategy using a computer, storage, and network virtualization, where VMware is the industry leader. Server virtualization (ESXi) gives us hardware abstraction so we use HPE, Dell, or Lenovo servers in the same way. Storage virtualization (vSAN, vVols) gives us storage abstraction and independence on storage vendors. Network virtualization does the same for network components like a switch, router, firewall, and load balancer. 

When we virtualize all hardware components we have a software-defined infrastructure. If we do not want to plan, design, implement and operate software-defined infrastructure by ourselves, we can outsource it to cloud providers and consume it as a service. This is IaaS cloud infrastructure.

If we consume IaaS cloud infrastructure, we can solve the MULTI-VENDOR strategy using MULTI-CLOUD. The MULTI-CLOUD strategy is based on the assumption that if one IaaS cloud provider fails, the other cloud providers will not fail at the same time, therefore such strategy has a positive impact on the availability and/or recoverability.

And if we already have an adopted MULTI-CLOUD strategy, then we only lack modernly designed applications that can automatically detect an infrastructure failure of one cloud provider and recover from it by a fast application fail-over to another cloud. Kubernetes can help with multi-cloud from an infrastructure point of view but in the end, it is all about the application architecture having self-healing natively within application DNA. The application architected for MULTI-CLOUD architecture is, at least for me, the CLOUD NATIVE APPLICATION. The application, which is able to live in the cloud and survive inevitable failures. This is exactly how the human body works and how the human civilizations are migrating between the regions. That's why we have multi-site and multi-region architectures and cloud-native applications are able to recognize where is the best place to live, do some cost analysis and migrate if it makes sense. Isn't it similar to humans? 

And that's it. Easy to write, isn't it? ... The real implementation of MULTI-CLOUD architecture is a bit trickier, but with today's technology, it's feasible.